 P4 Software
/
logisticaHQ-en
P4 Software
/
logisticaHQ-en
P4 Software
/
logisticaHQ-en
P4 Software
/
logisticaHQ-en
A dashboard is a board of widgets, each in its own panel, arranged the way you want them: a chart of orders shipped per day beside the number of late orders and a gauge of picking accuracy. Every saved dashboard gets its own entry in the menu under Analytics > Custom dashboards, where people open it to read it.
Build dashboards in Setup > Reporting > Dashboards. Only office users can build and change dashboards.
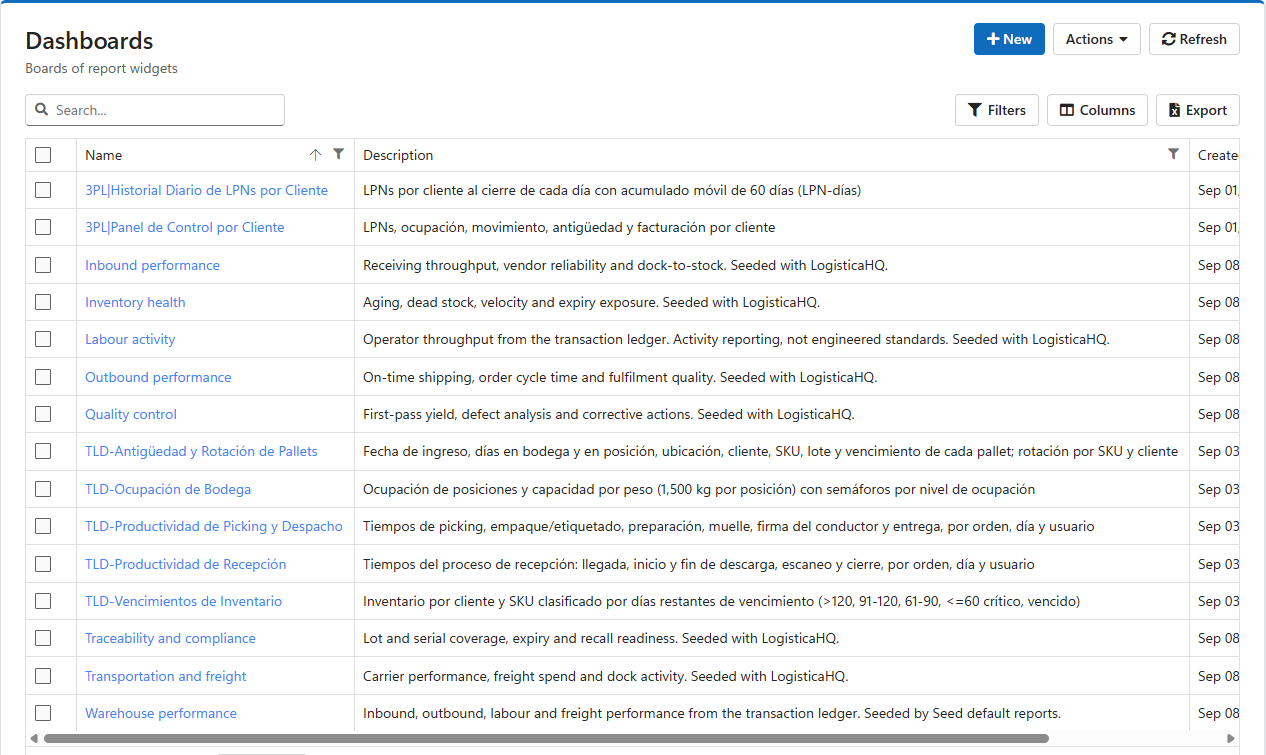
Each row is one dashboard, with its Name, Description and Created date. Double-click a row to open it in the designer.
| Button | What it does |
|---|---|
| New | Asks for a name and a description, creates the dashboard and opens it in the designer. |
| Actions > Refresh | Reads the list again. |
| Actions > Delete | Removes the ticked dashboards after you confirm. Their widgets are kept. |
| Actions > Export | Downloads the ticked dashboards as a file, to copy them to another LogisticaHQ company. |
| Actions > Import | Loads dashboards from an exported file. |
| Actions > Seed default reports | Installs LogisticaHQ's standard report library: a set of performance widgets and a Warehouse performance dashboard built on data you already capture. Reports you already have are left untouched, so it is safe to run again; it only adds what is missing. |
A new dashboard appears in the menu the next time you sign in: sign out and back in after creating one.
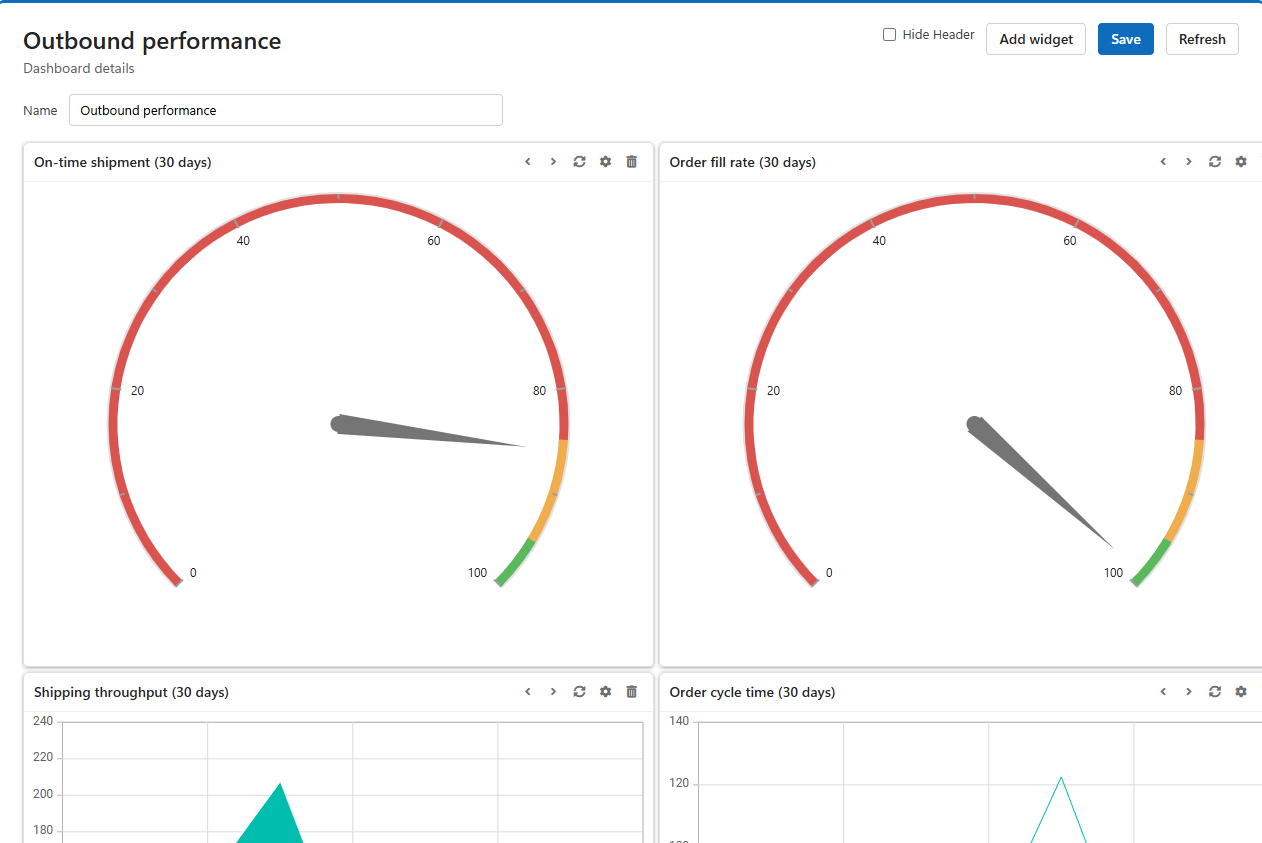
| Control | What it does |
|---|---|
| Name | The dashboard's name, as the menu shows it. |
| Hide Header | Hides the title bar of every panel, for a dashboard shown on a wall screen. |
| Add widget | Lists every widget with its description. Pick one and it is added as a new panel, at once. |
| Save | Saves the dashboard's name, its header setting and where every panel sits and how big it is. |
| Refresh | Reads the dashboard again, dropping any arrangement you did not save. |
Arrange the panels by dragging them by their title bar, and resize one by dragging its edge or corner. Press Save when the layout is right; until then, a Refresh puts the panels back where they were.
| Icon | What it does |
|---|---|
| The title | Opens the widget behind the panel, to change its query or presentations. |
| Previous / Next | Switch the panel between the widget's presentations, for example from its chart to its grid. |
| Refresh | Runs the panel's query again. |
| Options (the cog) | Opens the panel's options (below). |
| Remove | Takes the panel off the dashboard, at once. The widget itself is kept. |
| Field | What it is |
|---|---|
| Name | The panel's title. It starts as the widget's name. |
| Description | A note about the panel. |
| Refresh interval (seconds) | How often the panel runs its query again on its own, for a dashboard left open on a screen. Empty or 0 refreshes only when someone presses Refresh. |
| Hide Header | Hides this panel's own title bar. |
| One box per filter | A value for each filter the widget's query declares, for this panel only (see below). |
A widget's query can declare filters, written @{Label} for text, @{Label:number} for a number and @{Label:date} for a date (see Widgets). Each panel showing that widget gets a box per filter in its options, and the panel's query runs with the values typed there. So one widget Orders shipped per day, filtered on @{Warehouse}, can sit twice on a dashboard: once set to warehouse 1001 and once to 1002.
Office users reading the dashboard under Analytics > Custom dashboards can also open a panel's Filters, change a value and press Apply; the panel reruns with the new value. The value is saved on the panel, so it changes the dashboard for everyone. Client portal users see the panels with the values set, and cannot change them.
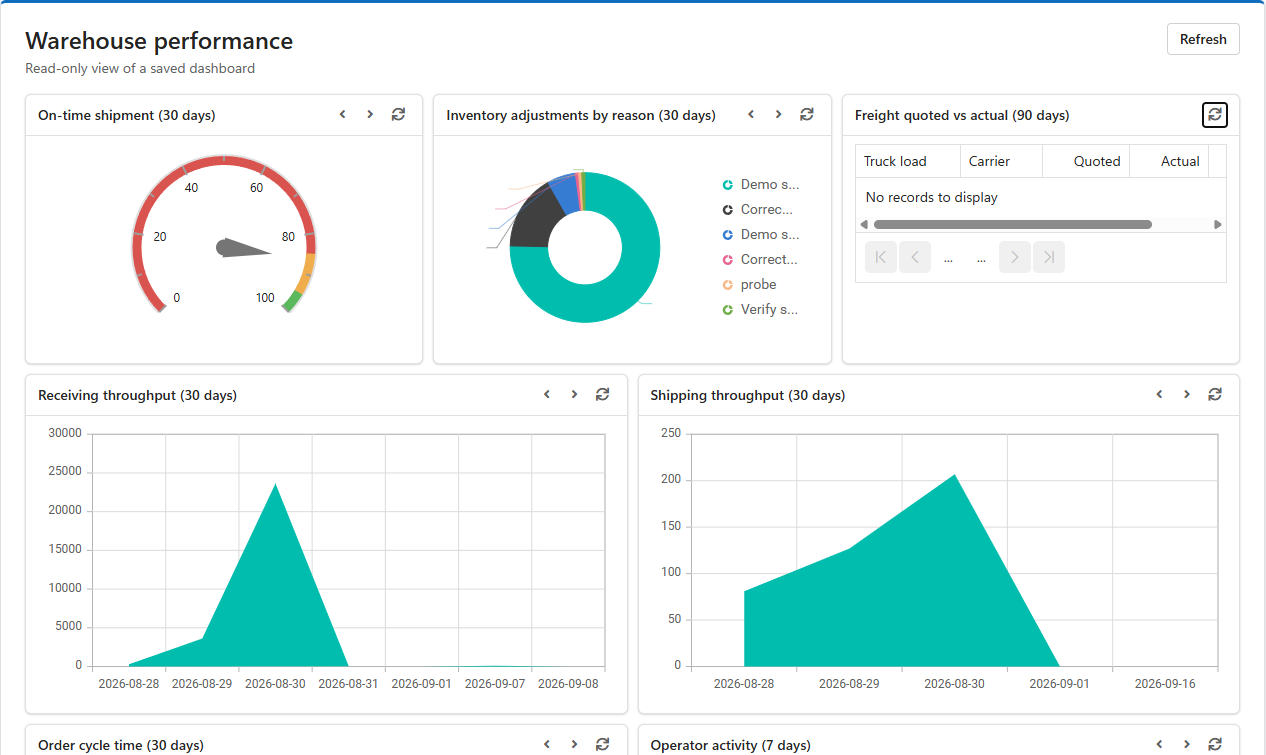
Open Analytics > Custom dashboards and pick the dashboard. The panels show their data as the designer arranged them, and cannot be moved there. Each panel keeps its Previous/Next, Refresh and Filters, and panels with a refresh interval update themselves.
What a panel shows depends on who is reading. A widget whose query filters on @ClientId shows a client user only that client's data and shows warehouse staff every client, so the same dashboard serves both.
| What you see | Why, and what to do |
|---|---|
| The dashboard is not in the menu | The menu is read when you sign in. Sign out and back in. |
| A panel is empty | Its widget's query returned no rows, or the presentation names a column the query does not return. Open the widget from the panel's title and press Execute. |
| The layout went back | It was not saved. Arrange the panels again and press Save. |
| A panel's filter has no box | The widget's query spells the placeholder wrongly. Write @{Label}, @{Label:number} or @{Label:date}. |
Was this page helpful?